The Problem With Print
You spent $5,000 on brochures. They look beautiful. You handed out 2,000 at the trade show.
How many people actually read them?
No idea. That's the problem with print. Once it leaves your hands, it's a black box. Did they toss it immediately? Skim the cover? Read every page? In practitioner communities, the same theme keeps coming up: print still has a place, but it's hard to measure and harder to optimize.
QR codes won't fix print. But they do crack open the black box.
They also aren't niche anymore: Bitly's QR statistics and Uniqode's campaign benchmark examples both show mainstream usage, and Pew mobile adoption data explains why scanning works in day-to-day campaigns.
The Bridge: Print to Digital
A QR code on your print materials links to a digital version. When someone scans, you suddenly have data:
- They engaged enough to scan
- You know when they did it
- You can track what they read next
- You can capture their email for follow-up
Print becomes measurable.
Use Cases That Work
Business Cards
Your business card has limited space. A QR code can link to:
- Your full portfolio (flipbook)
- Your LinkedIn profile
- A video introduction
- A landing page with booking link
Someone scans after meeting you at a conference. You get a notification. Now you have a warm lead instead of a forgotten card in a drawer.
Brochures and Catalogs
Print catalogs are expensive to update. Prices change. Products evolve.
Link to a digital catalog that's always current. Print the QR code once, update the digital version anytime.
Plus, you see which products people actually look at.
Event Materials
Conference programs, booth displays, handouts. All perfect for QR codes.
Link to:
- Digital program with live updates
- Session recordings
- Presenter bios
- Post-event resources
Product Packaging
Physical products can link to:
- User manuals (no more lost paper manuals)
- How-to videos
- Registration and warranty info
- Related products
Real Estate Signs
For sale signs with QR codes linking to:
- Full property presentation
- Virtual tour
- Agent contact info
- Similar listings
The buyer scanning at 9pm on a Sunday? You see that activity Monday morning.
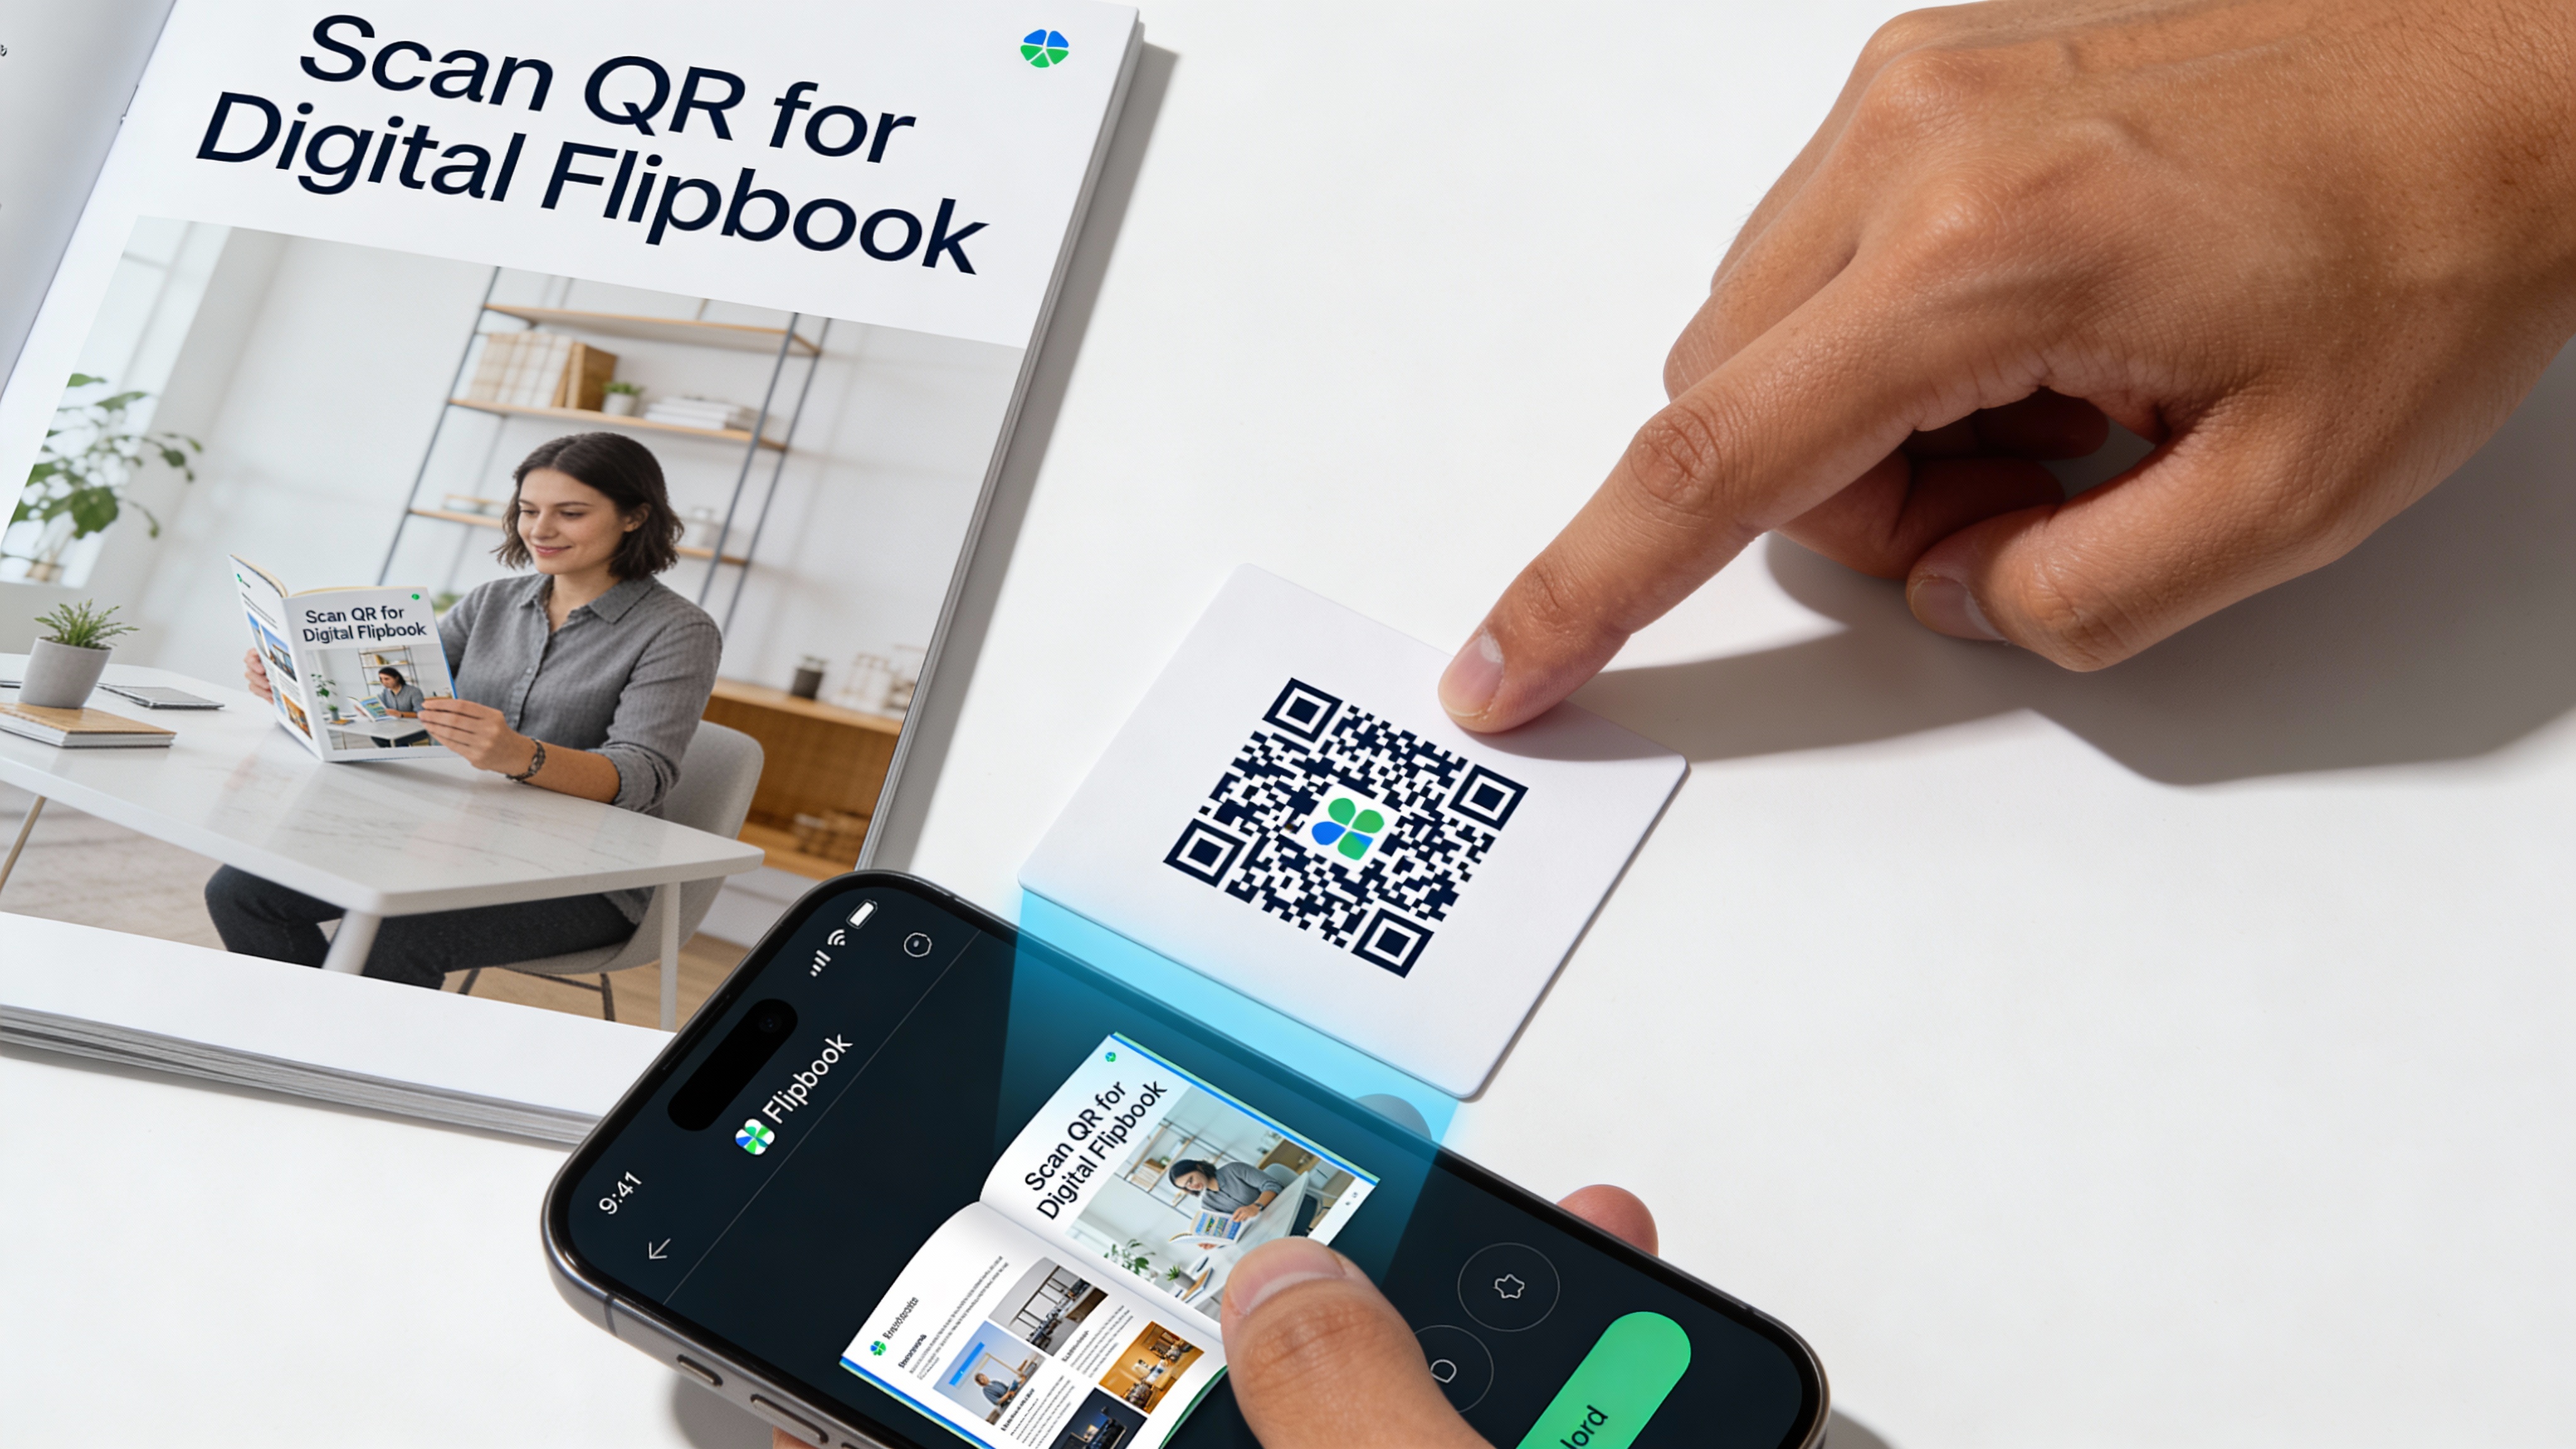
Creating QR Codes for Flipbooks
Step 1: Get Your Flipbook URL
In Flipbooker, open your flipbook and copy the share URL:
YOUR_FLIPBOOK_URL
Step 2: Generate a QR Code
Use Flipbooker's QR generator or any QR tool. Paste your URL, generate the code.
Step 3: Download High-Resolution
For print, you need high resolution. Download at least 300 DPI for anything that gets printed. Vector formats (SVG, PDF) are best.
Step 4: Add to Your Design
Place the QR code in your print design. Make sure it's large enough to scan (at least 1 inch / 2.5 cm square).
Step 5: Test Before Printing
Print a test page. Scan with multiple phones. Verify it works before running 10,000 copies.
Tracking QR Code Scans
Basic Tracking
Even without Flipbooker, you can track scans with UTM parameters:
YOUR_FLIPBOOK_URL?utm_source=tradeshow&utm_medium=brochure&utm_campaign=spring2026
Google Analytics shows you traffic from each campaign.
Advanced Tracking With Flipbooker
When someone scans and opens your flipbook, Flipbooker tracks:
- When they scanned (date, time)
- What they read (page by page engagement)
- How long they spent (total time, per page)
- What they clicked (links, videos, buttons)
- Their location (city level, not creepy-specific)
If you have lead capture enabled, you also get their email when they sign up to access gated content.
Creating Campaign-Specific QR Codes
Create different QR codes for different campaigns:
- Tradeshow A →
?utm_campaign=tradeshow-nyc - Tradeshow B →
?utm_campaign=tradeshow-chicago - Mailed brochure →
?utm_campaign=direct-mail-q1
Now you know which print campaigns drive engagement.
Best Practices
Size Matters
Minimum size for reliable scanning: 1 inch (2.5 cm) square. Bigger is better. A tiny QR code in the corner won't get scanned.
Placement Matters
Put QR codes where people naturally look:
- Back cover of brochures
- Near the product image on packaging
- Eye level on signs
- Inside of business card (less cluttered than front)
Don't bury it in a busy design. Give it white space.
Add a Call-to-Action
A naked QR code gets fewer scans than one with context:
❌ Just a QR code
✅ "Scan for virtual tour" ✅ "Scan to see full catalog" ✅ "Scan for video demo"
Tell people what they'll get.
Test on Multiple Devices
Not all QR scanners are equal. Test with:
- iPhone camera app
- Android camera app
- A dedicated QR scanner app
- Low-light conditions
- Different distances
If it fails on any common device, increase size or reduce complexity.
Use Dynamic QR Codes (If Possible)
Static QR codes encode the URL directly. If your URL changes, you need new codes.
Dynamic QR codes redirect through a service. You can change the destination without reprinting. Worth considering for expensive print runs.
Common Mistakes
Too Small
The most common mistake. If it's smaller than 1 inch, you're gambling on scan success.
Too Complex
Long URLs create dense, complex QR codes that are harder to scan. Use URL shorteners or cleaner URLs.
No CTA
People don't scan mystery codes. Tell them why they should scan.
Not Testing
Print 50,000 brochures. QR code doesn't scan. That's a $10,000 lesson you didn't need to learn. Test first. Print one page. Scan it with three different phones. Then print the rest.
Wrong Color Contrast
QR codes need contrast. Black on white is safest. Dark on light works. Light on dark or color-on-color often fails.
Forgot to Update the Link
Product page moved. Link is broken. QR codes lead nowhere. Keep destination URLs stable or use dynamic codes.
Measuring ROI
What to Track
- Scan rate: Scans ÷ printed materials distributed
- Engagement rate: Average time on flipbook after scan
- Lead capture rate: Emails collected ÷ scans
- Conversion rate: Purchases or meetings from scans
What Scan Rates Actually Look Like
QR code scan rates vary wildly by context. Uniqode's campaign benchmarks show scan-through rates across industries:
- Restaurants: around 45% (people are hungry and motivated)
- Events and services: around 18%
- Food and beverage packaging: around 15%
- Retail: around 6%
- Real estate: around 5%
A New Brunswick tourism campaign using direct mail with QR codes reported a 1.77% engagement rate, which was considered a strong result for that channel.
The value isn't just in raw scan counts.
Use this interpretation model:
- Scan rate: top-of-funnel attention from print.
- Time on destination content: depth of interest.
- Repeat scans/returns: stronger buying signal than one-time curiosity.
- Lead capture after scan: whether attention turns into contactable pipeline.
A 5% scan rate on 2,000 brochures is 100 people who told you they're interested. Without the QR code, they're invisible.
Print isn't dead, but it is blind. QR codes give it eyesight. The trick is keeping expectations honest: most people who pick up your brochure won't scan. But the ones who do are telling you something. They're interested. They want more. And now, instead of a card in a drawer, you have a trail you can follow up on.